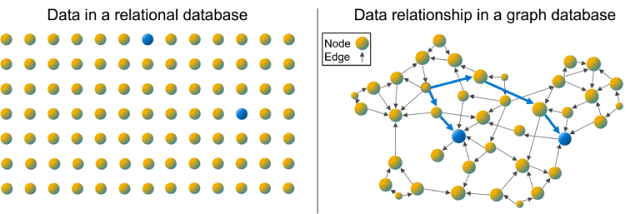
In order to explore relationships between extremely large volumes of data with speed and efficiency, graph analytics have been emerging to fill the need when that is not easily achieved with traditional or relational databases.
The logical structure of tables and columns used by relational databases makes it difficult to connect all the information and analyze how it is linked, especially when trying to analyze relationships in multiple layers. The more layers you try to analyze, the harder it gets from a relational database perspective, given that you need to access more tables. The chart on the left, shows how all the data is connected to what you are trying to analyze. On the right, graph-powered analytics was able to connect all the data using a node and edge approach, where edges represent the connections between two nodes.
The ability to understand the relationship between different, and dispersed, data points makes it possible to perform deeper analysis and deliver the results as information that can be easily understood and acted upon. If you think about healthcare and all the different applications used to collect data about a patient, you can quickly see how this approach to analytics has tremendous value. The image below, generated by TigerGraph for UnitedHealth Group, illustrates how information derived from graph analytics can be presented to a doctor as an interconnected timeline so everything can be seen at a glance to better serve their patients.
Source: Courtesy of TigerGraph.
Knowledge graph analytics can also translate into significant savings in time and money. For example, UnitedHealth Group implemented TigerGraph in its contact centers and estimated it has saved $150 million a year by enabling its medical professionals to provide accurate and effective care path recommendations in real time. TigerGraph has been one of the leading vendors in the graph analytics field, and Dell Technology customers have had great success when implementing it on Dell infrastructure. There are a few major features that makes TigerGraph a great partner:
◉ Graph 3.0 technology: TigerGraph is landing on the third and latest existing version of graph analytics, compared to its main competitors that are using the 1.0 or the 2.0 versions.
◉ High performance: The whole graph is located in memory, which means that to read the data you do not needed to access the CPU, hard drive or any SSD’s. All the data is on compute.
◉ Parallel loading and updates: For relational or traditional database, any updates are held in the batch form, which force updates to sit on a queue in the system until the next routine update time. But for TigerGraph, as soon as the data is being updated, the graph will be updated immediately.
◉ Data Sharding: Within TigerGraph, partitioning the data is native, so the graph data is split within the cluster within each server. This way, you can do parallel computing, enabling a faster performance. And as there is redundancy, if one server is down, then it will still be able to function.
◉ Scalability: While most other vendors have a graph size limitation of one terabyte, TigerGraph doesn’t have any limitation, making it scalable solution. Also, it is native within the TigerGraph software to scale up and down, so more servers can be added as needed and it will become part of the cluster.
◉ MultiGraph: This security and privacy feature refers to when the data set is loaded up into a graph form, the whole graph is going to be generated in the back end. However, depending on the role-based access that each user has, they are only going to be able to see the portion that they are allowed to see.
◉ Deep-links analytics: The depth of the data analysis is measured in how many hops or levels. When relationship analysis is done, the deeper the layer that you go into, the harder it becomes and more compute and memory resources are needed. TigerGraph is the only software able to do 10 plus levels of analytics.
◉ Storage efficiency: The raw data is compressed so it saves lot of storage space, making it efficient within the compute cluster.
Source: dell.com


0 comments:
Post a Comment